Introduction
Choosing the right observability tool can be difficult because modern applications produce a large amount of data from servers, containers, databases, APIs, and cloud services. An effective observability solution helps teams understand what is happening inside their systems by using telemetry such as metrics, logs, and traces.
In this Observability Tools Comparison, we look at popular approaches such as OpenTelemetry, Prometheus, Grafana, and commercial observability platforms. The goal is not to name one tool as the winner. Instead, it is to explain where each option works best and what teams should consider before choosing one.
What Is Observability?
Observability is the ability to understand the internal state and behavior of a system by examining the information it produces.
Modern observability usually focuses on three major telemetry signals:
- Metrics – numerical measurements such as CPU usage, request rates, latency, and error rates.
- Logs – records of events generated by applications and infrastructure.
- Traces – information showing how a request travels through different services.
OpenTelemetry currently supports traces, metrics, logs, and baggage, while profiles are also being developed within the project.
This makes observability especially useful for cloud applications, microservices, Kubernetes environments, APIs, and distributed systems.
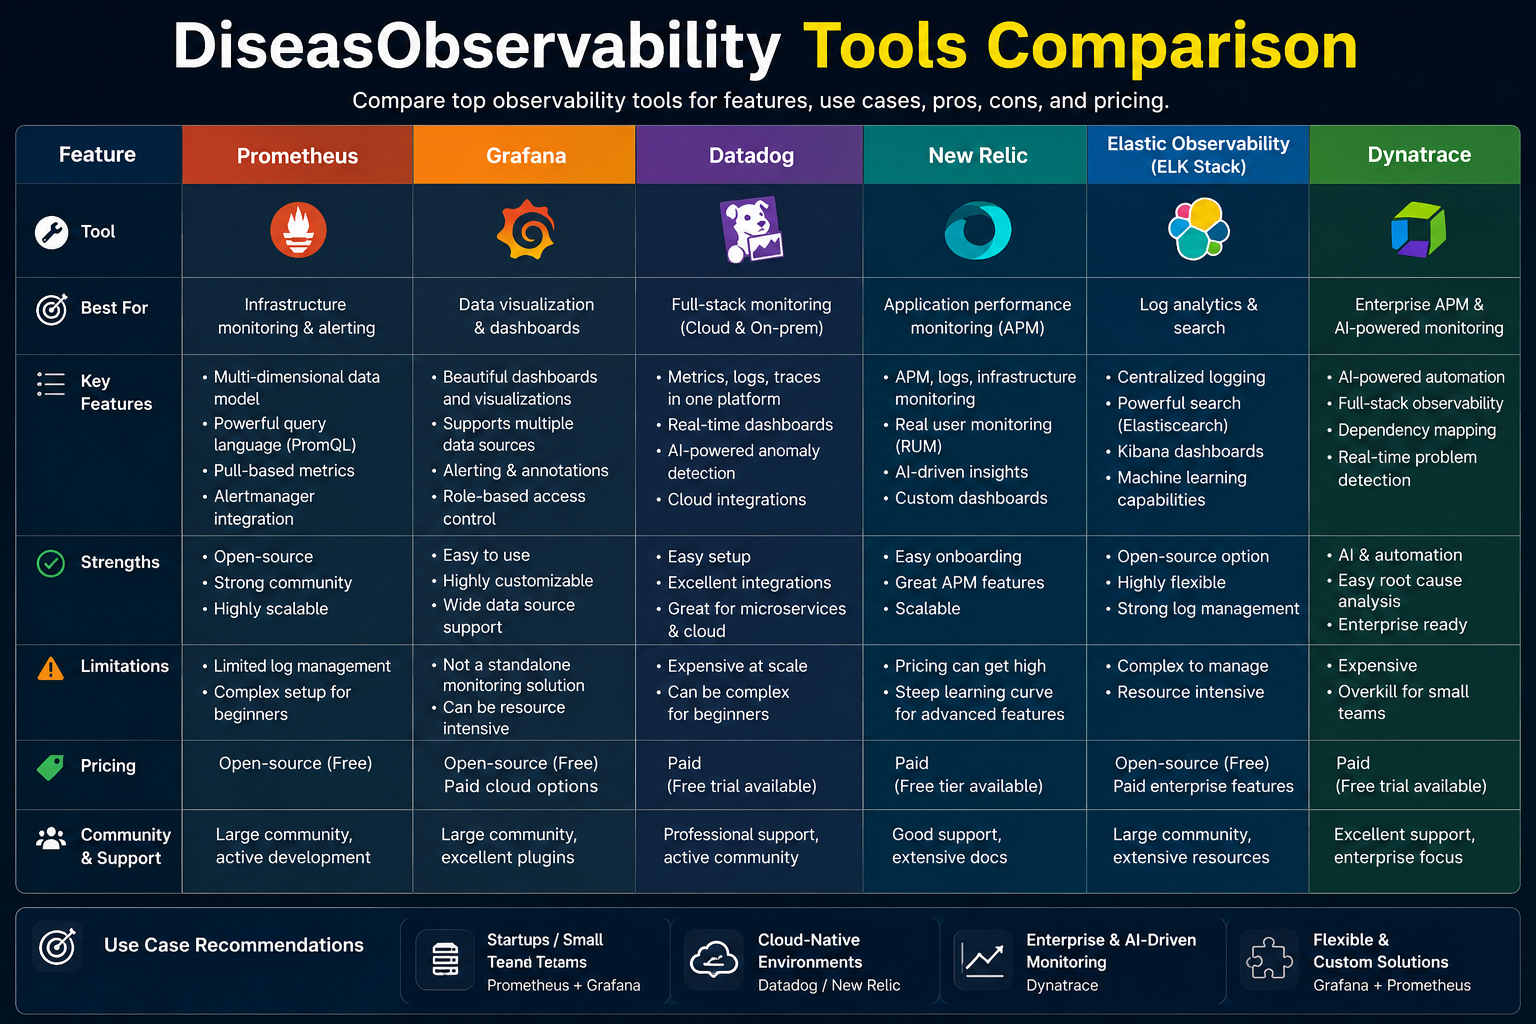
Observability Tools Comparison
| Tool | Main Strength | Best For | Open Source | Main Role |
|---|---|---|---|---|
| OpenTelemetry | Vendor-neutral telemetry | Instrumentation and data collection | Yes | Collect and export telemetry |
| Prometheus | Metrics and alerting | Infrastructure and cloud-native monitoring | Yes | Metrics collection and storage |
| Grafana | Dashboards and visualization | Monitoring and data analysis | Yes | Visualization and alerting |
| Datadog | Integrated commercial platform | Large and growing teams | No | Full observability platform |
| New Relic | Application monitoring | APM and developer monitoring | No | Application and infrastructure observability |
| Dynatrace | Enterprise observability | Large complex environments | No | Full-stack monitoring |
| Elastic Observability | Search and analytics | Logs, metrics, traces, and search | Partly | Observability and analytics |
The exact features, limits, and pricing of commercial products can change, so teams should check the provider’s current documentation before making a purchasing decision.
1. OpenTelemetry
OpenTelemetry is different from many traditional observability platforms. It is an open-source, vendor-neutral framework for generating, collecting, and exporting telemetry. It is not itself an observability backend.
One of its biggest advantages is flexibility. Teams can instrument applications with OpenTelemetry and send the resulting telemetry to different backends.
OpenTelemetry supports traces, metrics, and logs, and its Collector can receive, process, and export telemetry.
Why choose OpenTelemetry?
OpenTelemetry can be a strong choice when:
- You want to reduce vendor lock-in.
- You use multiple observability platforms.
- You need standardized telemetry.
- You operate cloud-native applications.
- You want control over instrumentation and data pipelines.
However, OpenTelemetry does not replace a complete backend. You still need somewhere to store, query, visualize, and analyze the collected data.
2. Prometheus
Prometheus is an open-source monitoring and alerting toolkit that focuses heavily on metrics. It stores metrics as time-series data and uses labels to provide a flexible dimensional data model.
Prometheus is particularly popular in cloud-native and Kubernetes environments.
Its query language, PromQL, allows users to analyze time-series data and create monitoring and alerting rules.
Why choose Prometheus?
Prometheus is useful when you need:
- Strong metrics monitoring.
- Open-source infrastructure.
- Flexible time-series queries.
- Cloud-native monitoring.
- Integration with Grafana.
- Custom alerting.
Prometheus is not intended to be a complete replacement for every observability component. For example, teams may combine it with OpenTelemetry for instrumentation and Grafana for visualization.
3. Grafana
Grafana is primarily known for dashboards, visualization, analytics, and monitoring.
It can work with Prometheus and many other data sources. The Prometheus project itself documents Grafana as a visualization platform that can query Prometheus data.
Grafana is useful when teams want to turn monitoring data into dashboards that developers, engineers, and operations teams can understand quickly.
Why choose Grafana?
Grafana is a good option for:
- Custom dashboards.
- Infrastructure monitoring.
- Metrics visualization.
- Multiple data sources.
- Alerting.
- Technical teams that want flexibility.
One important point is that Grafana and Prometheus are often used together rather than treated as direct competitors.
4. Datadog
Datadog takes a different approach from individual open-source components. It provides a commercial observability platform designed to bring multiple monitoring capabilities into one environment.
This approach can reduce the amount of infrastructure a team needs to manage itself.
The main advantage of a commercial platform is convenience. Instead of building and maintaining multiple components, organizations can use a managed service and focus more on monitoring their applications.
The trade-off is cost and dependence on the vendor’s platform and pricing model.
5. New Relic
New Relic is another commercial observability platform with a strong focus on application performance monitoring and software performance.
It can be attractive to development teams that want application-level visibility without building a complete monitoring stack themselves.
A commercial platform can also simplify the process of connecting application performance information with infrastructure and operational data.
Before selecting it, organizations should evaluate their telemetry volume, required features, team size, and expected long-term costs.
6. Dynatrace
Dynatrace is designed for enterprise environments where organizations may need visibility across applications, infrastructure, cloud services, and complex technology stacks.
It can be particularly useful for larger organizations that need broad monitoring capabilities from a commercial platform.
The main consideration is whether the platform’s enterprise features justify its cost and operational model for your organization.
Open-Source vs Commercial Observability Tools
One of the biggest decisions in an observability tools comparison is whether to build an open-source stack or use a managed commercial platform.
Open-source approach
A common open-source architecture can include:
OpenTelemetry → Prometheus → Grafana
OpenTelemetry can collect and export telemetry, Prometheus can handle metrics, and Grafana can provide dashboards and visualization.
This approach provides significant flexibility. However, your team may need to manage configuration, upgrades, storage, scaling, security, and troubleshooting.
Commercial approach
A commercial observability platform generally provides more of the infrastructure as a managed service.
This can mean:
- Faster setup.
- Less infrastructure maintenance.
- Centralized tooling.
- Vendor support.
- Integrated monitoring features.
The main downside can be higher or less predictable costs as telemetry volume and infrastructure grow.
OpenTelemetry vs Prometheus
OpenTelemetry and Prometheus are sometimes compared directly, but they solve different problems.
OpenTelemetry is a framework for generating, collecting, processing, and exporting telemetry. Prometheus is primarily a metrics monitoring and time-series system.
They can therefore work together.
For example, an organization can use OpenTelemetry to instrument applications and collect telemetry while using Prometheus for metrics monitoring.
Prometheus vs Grafana
Prometheus and Grafana are also complementary technologies.
Prometheus focuses on collecting, storing, querying, and alerting on metrics. Grafana focuses heavily on visualization and dashboards.
This means a common setup can use Prometheus as a metrics source and Grafana as the interface through which engineers explore that data.
What Should You Look for in an Observability Tool?
Before choosing a platform, consider these important areas.
1. Telemetry Support
Check whether the solution supports the signals you actually need.
If your team needs metrics, logs, and traces, selecting a solution that handles all three can make correlation easier.
2. OpenTelemetry Support
OpenTelemetry has become an important part of modern observability because it provides vendor-neutral instrumentation and telemetry collection.
A platform that works well with OpenTelemetry can give your organization more flexibility when your technology stack changes.
3. Scalability
A monitoring solution should handle your current workload and future growth.
Consider:
- Number of services.
- Number of hosts.
- Telemetry volume.
- Number of users.
- Retention requirements.
- Query performance.
4. Ease of Use
A technically powerful platform is not useful if engineers cannot quickly understand the information it provides.
Look for clear dashboards, useful search capabilities, understandable alerts, and good documentation.
5. Integration
Check whether the tool integrates with your existing:
- Cloud provider.
- Kubernetes environment.
- Databases.
- Programming languages.
- CI/CD tools.
- Incident management systems.
- Alerting systems.
6. Cost
Do not compare only the initial price.
Observability costs can grow with data volume, retention, users, hosts, and advanced features. Estimate your expected telemetry volume before selecting a platform.
Which Observability Tool Is Best?
There is no single best observability tool for every organization.
OpenTelemetry is a strong choice for vendor-neutral instrumentation and telemetry pipelines.
Prometheus is excellent for open-source metrics monitoring and cloud-native environments.
Grafana is a strong choice for dashboards and visualization across multiple data sources.
Commercial platforms such as Datadog, New Relic, and Dynatrace can be attractive when an organization wants a more integrated and managed observability experience.
For many engineering teams, the best solution is actually a combination of tools rather than one product.
A Practical Observability Stack
A modern stack might look like this:
Application → OpenTelemetry → Collector → Observability Backend → Grafana or Platform Dashboard
For metrics-focused environments, another common architecture is:
Application/Infrastructure → Prometheus → Grafana
The right architecture depends on the size of the organization, technical expertise, data volume, budget, and operational requirements.
Final Thoughts
This Observability Tools Comparison shows that different tools serve different purposes.
OpenTelemetry provides a vendor-neutral foundation for telemetry. Prometheus specializes in metrics monitoring, while Grafana provides powerful visualization and dashboard capabilities. Commercial platforms can provide a broader managed experience for teams that want less infrastructure to operate themselves.
The best choice is the one that matches your applications, team skills, telemetry requirements, budget, and long-term plans. Instead of choosing a tool simply because it is popular, first identify what you need to observe and how your team will use that information to find and solve problems.
Sources
- OpenTelemetry documentation: observability concepts and supported telemetry signals.
- OpenTelemetry overview and framework documentation.
- Prometheus official documentation.
- Grafana documentation for Prometheus and observability.
